Allele database
db.RdNorwegian database with 17 EXS17 markers and 6 additional markers.
Usage
data(db)Format
A data frame with 324 observations on the following 3 variables:
Markera factor with levels corresponding to name of markers
Allela numeric vector denoting allele
Frequencya numeric vector in (0,1)
Examples
data(db)
#Checks that frequencies add to 1
lapply(split(db$Frequency,db$Marker),sum)
#> $CSF1PO
#> [1] 1
#>
#> $D10S1248
#> [1] 1
#>
#> $D12S391
#> [1] 1
#>
#> $D13S317
#> [1] 1
#>
#> $D16S539
#> [1] 1
#>
#> $D18S51
#> [1] 1
#>
#> $D19S434
#> [1] 1
#>
#> $D1S1656
#> [1] 1
#>
#> $D21S11
#> [1] 1
#>
#> $D22S1045
#> [1] 1
#>
#> $D2S1338
#> [1] 1
#>
#> $D2S442
#> [1] 1
#>
#> $D3S1358
#> [1] 1
#>
#> $D5S818
#> [1] 1
#>
#> $D7S820
#> [1] 1
#>
#> $D8S1179
#> [1] 1
#>
#> $FGA
#> [1] 1
#>
#> $PENTA_D
#> [1] 1
#>
#> $PENTA_E
#> [1] 1
#>
#> $SE33
#> [1] 1
#>
#> $TH01
#> [1] 1
#>
#> $TPOX
#> [1] 1
#>
#> $VWA
#> [1] 1
#>
#Finds number of alleles for all markers
unlist(lapply(split(db$Frequency,db$Marker),length))
#>   CSF1PO D10S1248  D12S391  D13S317  D16S539   D18S51  D19S434  D1S1656
#>       10        7       19        9        9       20       11       14
#>   D21S11 D22S1045  D2S1338   D2S442  D3S1358   D5S818   D7S820  D8S1179
#>       19        8       11        9       11        9       15       10
#>      FGA  PENTA_D  PENTA_E     SE33     TH01     TPOX      VWA
#>       21       16       18       50        8        8       12
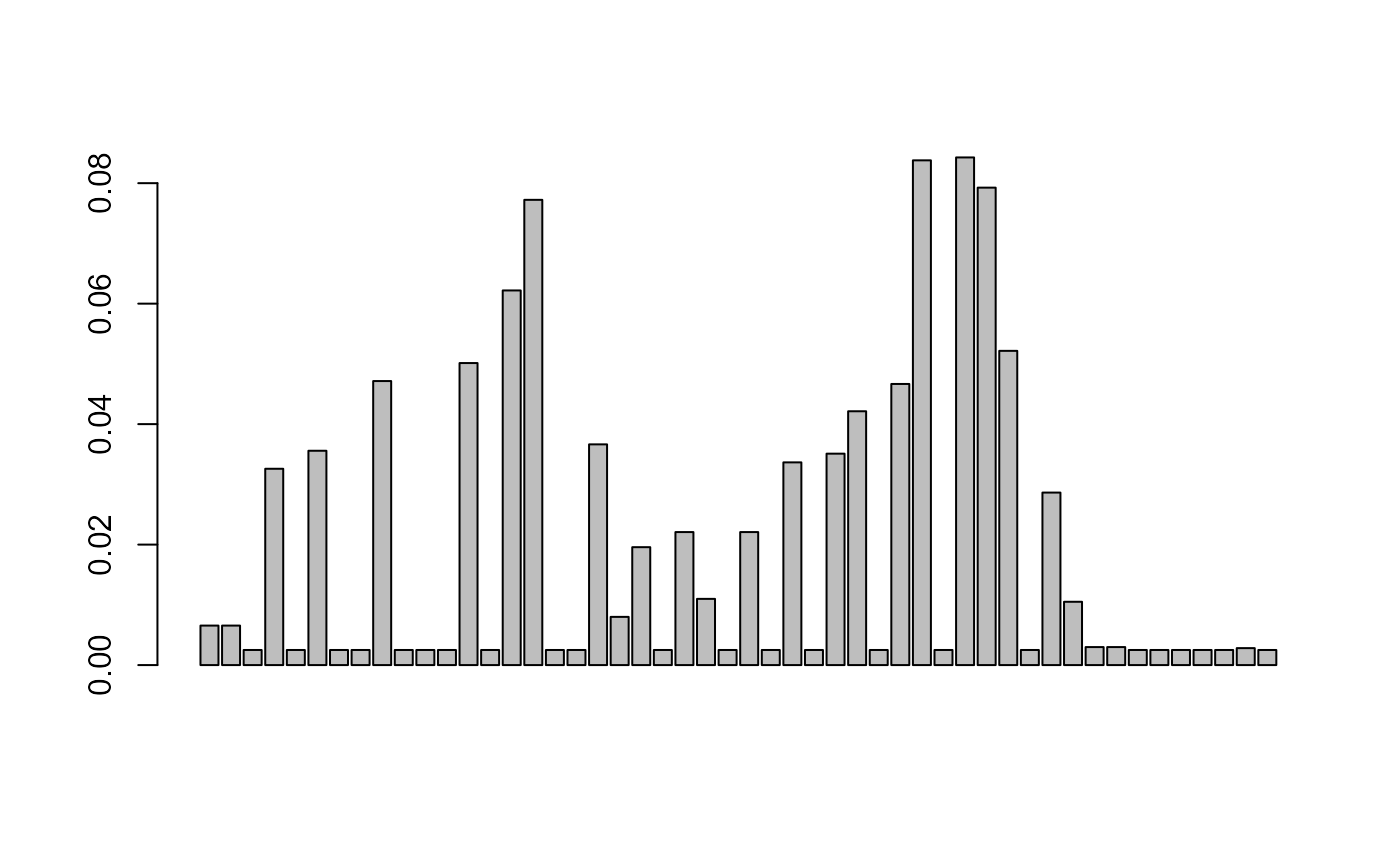
#A closer look at the marker SE33
SE33=db[db$Marker=="SE33",]
barplot(SE33$Frequency)
